Data-Driven Analytics and Geospatial Intelligence
Understanding urban environments requires more than single-city case studies or one-off extreme event analyses. We take a system-based perspective that integrates geospatial analytics, machine learning, and complex systems theory to uncover how cities respond to and interact with environmental stressors and risks. With diverse data sources from observations and remote sensing to weather forecasts and climate projections, we characterize the dynamics of urban climates while linking local urban phenomena to regional and global processes. Our research identifies emergent vulnerabilities across interconnected cities, clarifies how compound hazards evolve under climate change, and informs targeted and scalable mitigation strategies that extend beyond individual cities.
Geospatial Analytics for Urban Characterization
We leverage geospatial analytics to characterize both environmental stressors (e.g., heat, air pollution, extreme precipitation, and wildfires) and the effectiveness of mitigation strategies (e.g., urban trees).
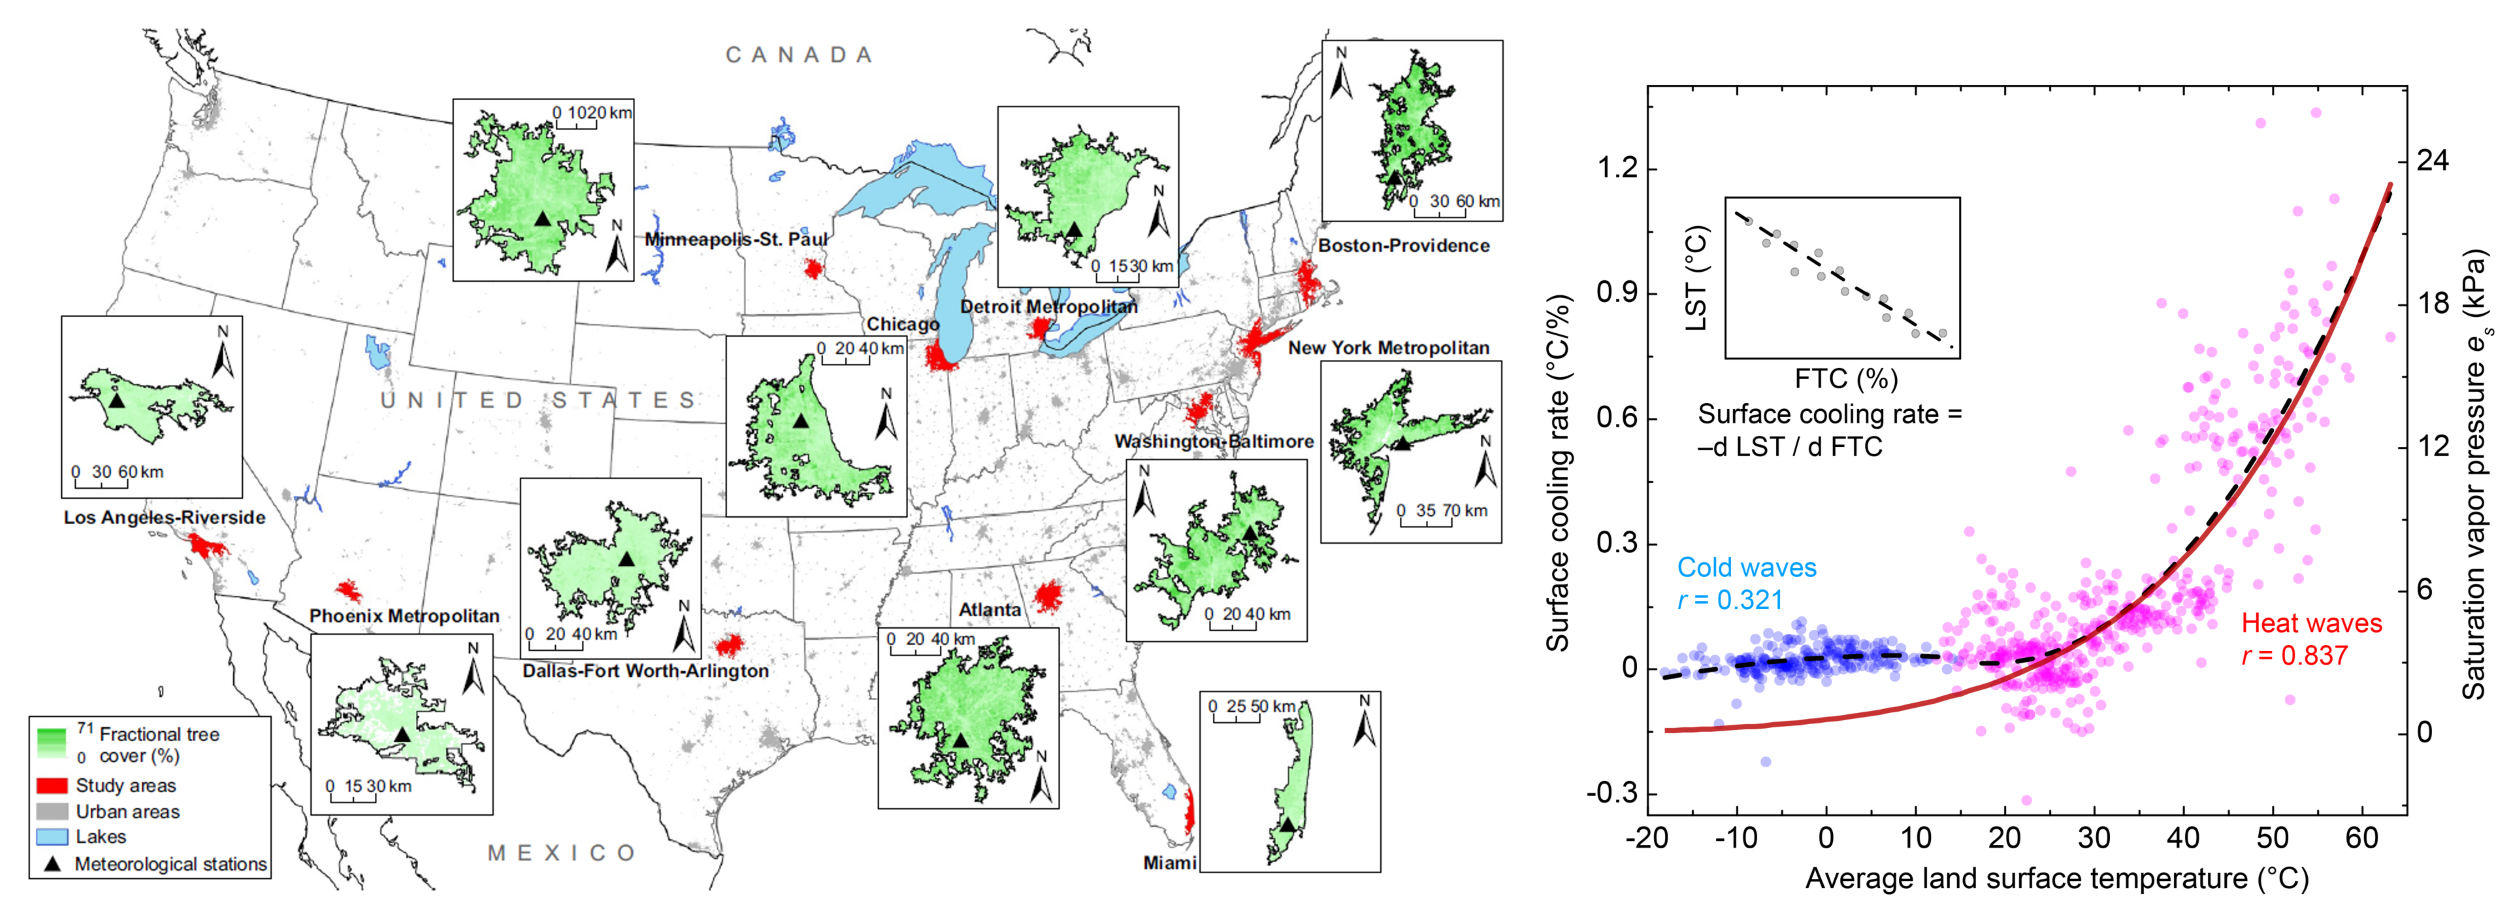
For example, our work was among the first to quantify the cooling capacity of urban trees during thermal extremes across major U.S. metropolitan areas (Wang et al., 2019). By analyzing long-term satellite observations, we introduced a generic metric called cooling rate, defined as the change in temperature per unit of fractional tree cover. We found that this cooling effect is nonlinear, with trees providing much stronger cooling under hotter conditions, a relationship that resembles thermodynamic liquid-water-vapor equilibrium. These results highlight the potential of vegetation as a scalable nature-based solution for mitigating urban heat stress.
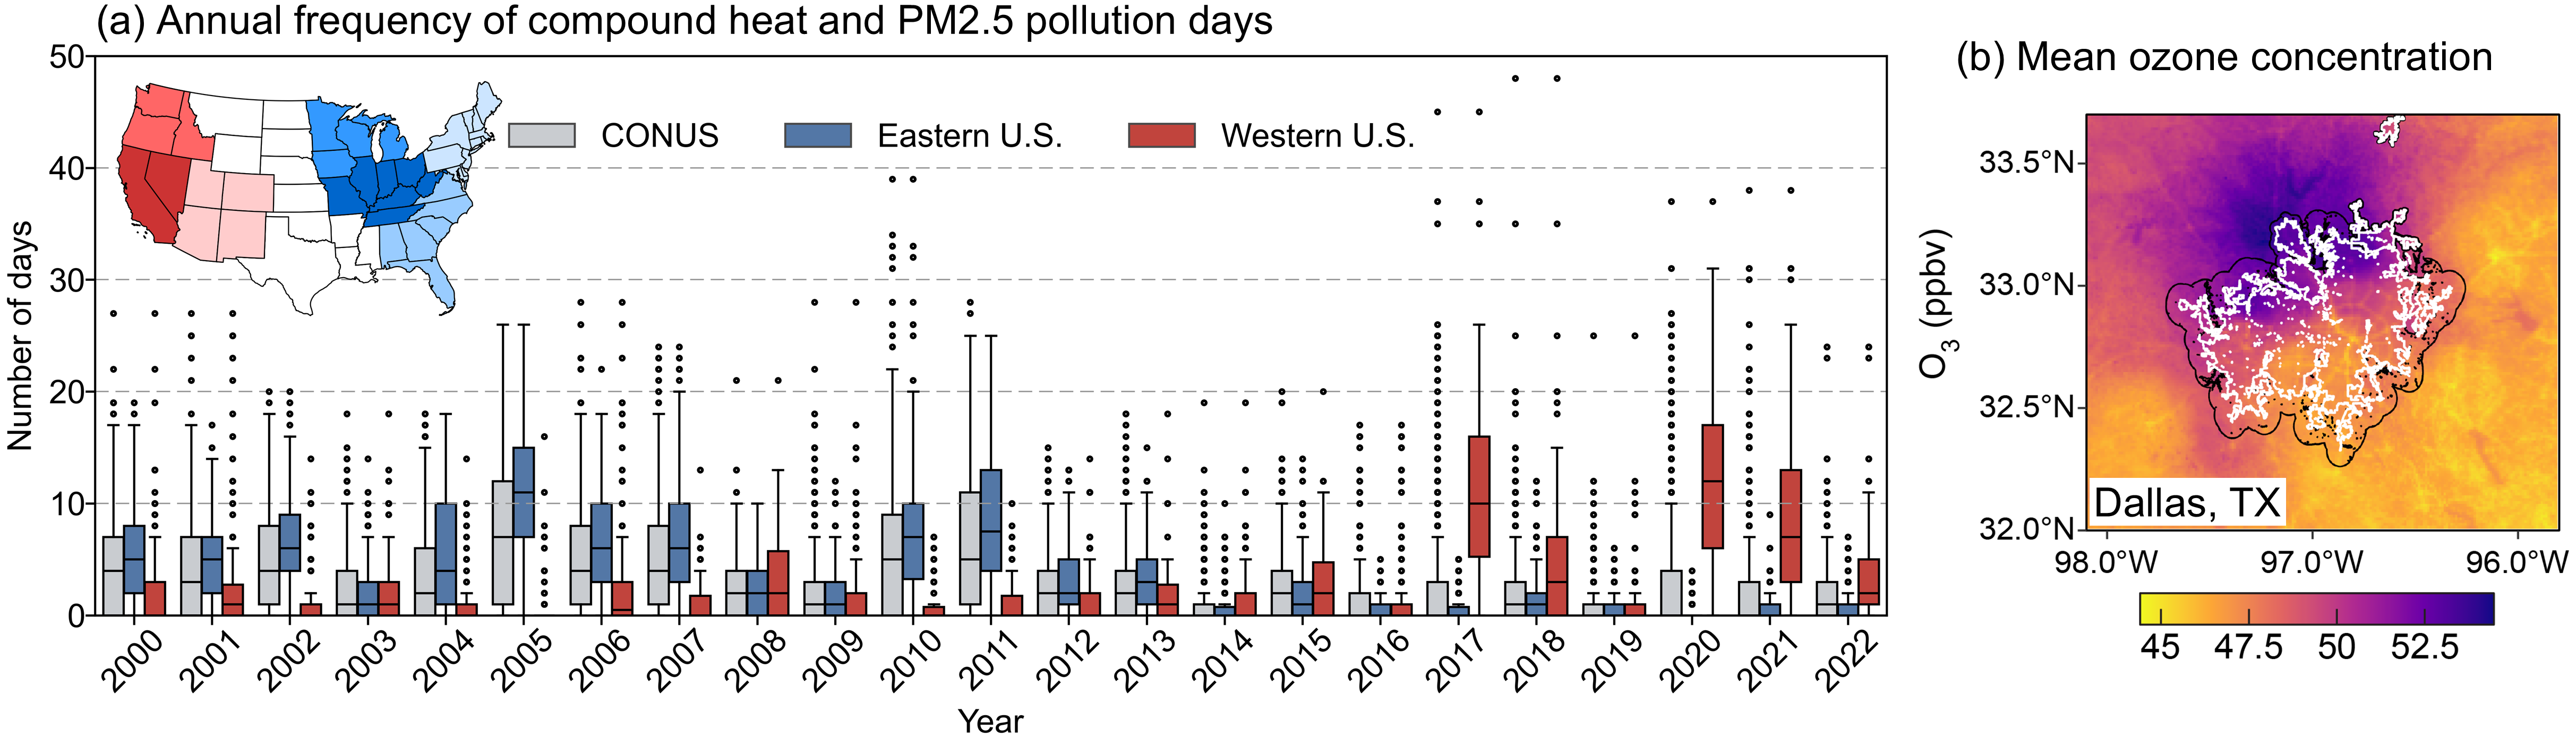
We also conducted the first continental-scale assessment of compound heat and air pollution events across all U.S. cities. These events, which simultaneously expose residents to both high temperatures and unhealthy levels of PM2.5 or ozone, were found to be more frequent and intense in urban than in rural areas. While PM2.5 episodes declined for many years, they have recently resurged in the western U.S. due to wildfire emissions (Leffel et al., 2025). However, ozone pollution events were often shorter and less severe in cities due to ferences in chemical regimes compared with rural surroundings (Wang et al., 2025). These insights directly informed our design of WRF-Chem simulations aimed at unraveling the mechanisms behind compound extremes.
Complex Systems and Climate Networks of Cities
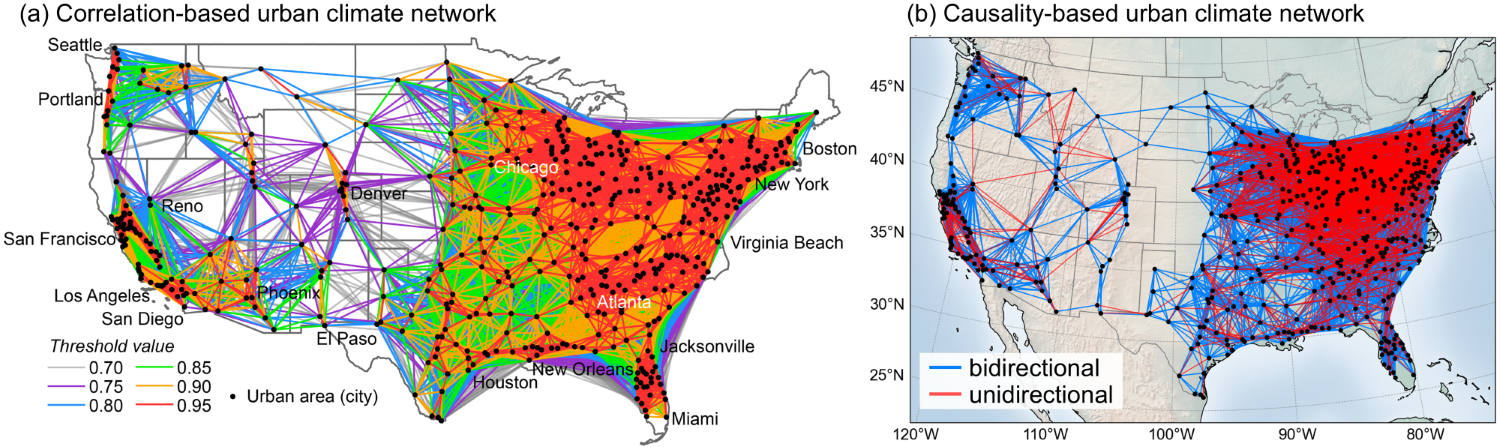
Traditional urban studies often analyze cities in isolation, but this overlooks how urban climates and urban systems are interlinked through shared environmental drivers and atmospheric transport. We pioneer the use of climate networks built directly from temperature, precipitation, and air pollution records to uncover these hidden connections. By treating each city as a node and their statistical or causal relationships as links, we can reveal emergent structures, ranging from clusters of cities that co-experience extremes, to hubs that disproportionately influence others, and teleconnections that span large distances. These approaches reframe urban climate analysis from isolated case studies to a networked perspective to advance our understanding of how hazards propagate, how vulnerabilities align across regions, and how mitigation strategies might be coordinated at scales beyond individual cities.
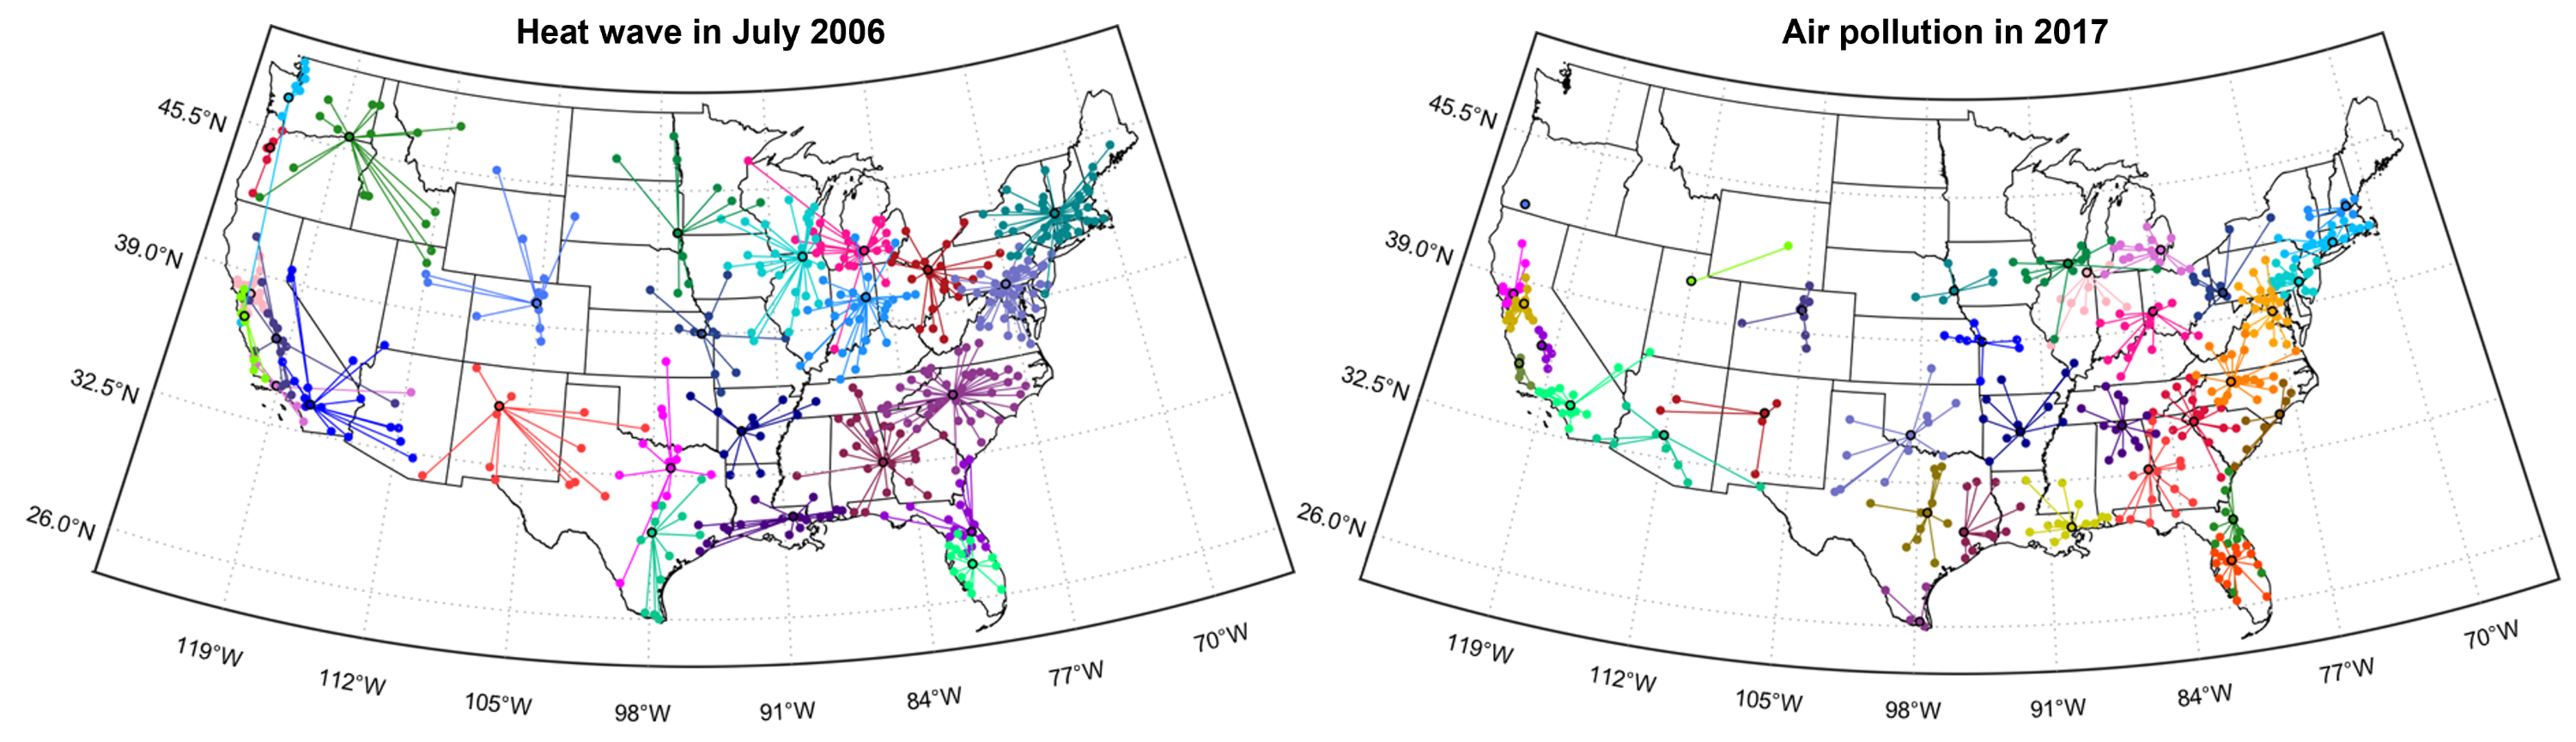
In one of our early contributions, we developed for the first time a message-passing-based framework to identify clusters of cities that experience similar extremes, such as heat waves, pollution episodes, and rainfall (Wang et al., 2020). The results revealed regionally connected groups shaped both by local meteorological similarity and by long-range transport.
Building on this, we have demonstrated that urban climate networks are modular and hierarchically organized, with strong regional clustering and “small-world” properties (short paths linking distant cities) (Wang et al., 2021). By integrating causal inference, we further uncovered how certain hubs act as influential drivers of variability across the network (Wang et al., 2025). This approach provides a new way to understand teleconnections, synchronization, vulnerabilities, and resilience pathways in urban climates.